| Navigation: User's Guide and Tutorials > Advanced Topics > The Debugger >====== Debugger Lesson ====== |    |
Clarion ships with a standalone 32-bit debugger; Cladb.exe. In Windows there exists the concept of a system “debugger”. When you install the Clarion debugger as the system debugger, it uses the API function DebugActiveProcess() to connect to the process that caused the debugger to execute.
Lesson
This lesson uses the ABC Template chain. You must register these templates (ABCHAIN.TPL) before starting the lesson.
Prepare Your Program for Debugging
In this Lesson you will debug the Orders application, installed by default as '\Lessons\Debugger\Orders.APP. We have deliberately created a bug in this application. To begin, start Clarion and open the Orders application.
In Windows XP, the Lessons folder is found in:
C:\Documents and Settings\All Users\Documents\SoftVelocity\Clarion7\Lessons
In Vista and Windows 7:
C:\Users\Public\Documents\SoftVelocity\Clarion7\Lessons
To debug your program with the debugger, you must tell the compiler to generate debug information. Use the Project Editor to establish this setting. (32-bit with debug information).
1.Open the Orders application with Clarion.
2.From the IDE menu, choose Project  Project Options to open the Project Properties.
3.Verify that the Configuration drop down list is set to Debug.
4.On the Compiling tab, select Full from the Debug Mode drop-down list.
5.Close the Project Properties dialog and Save your project changes if needed.
Identify the Bug
We have deliberately created a bug in the Orders application. To see it:
1.Set the Build Version to Debug (Choose Build  Set Configuration
  Debug)
2.Press the  button to make and run the Orders program.
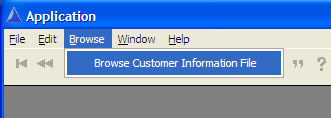
3.From the Orders program menu, choose Browse  Browse Customer Information File.
This opens the customer list.
4.With the customer list open, and using your mouse, highlight a customer in the middle of the list and click the down arrow button at the bottom of the scroll bar  to scroll down one row.
The list scrolls up! Using the arrow keys, the down arrow does nothing. Page Up, Page Down, Ctrl + Page Up, Ctrl + Page Down all work as expected.
You've identified the bug: it is in the BrowseCustomer procedure and it only occurs when scrolling down.
5.Close (exit) the Orders program.
The Clarion environment gains focus.
Start the Debugger
To start the debugger:
1.From the Clarion environment, press the  button to start the debugger.
You may want to shut down other applications to conserve resources because you will be running the Clarion environment, the debugger, plus the Orders program in addition to any others.
You can run the debugger independent of the development environment to save even more resources: run Cladb.EXE.
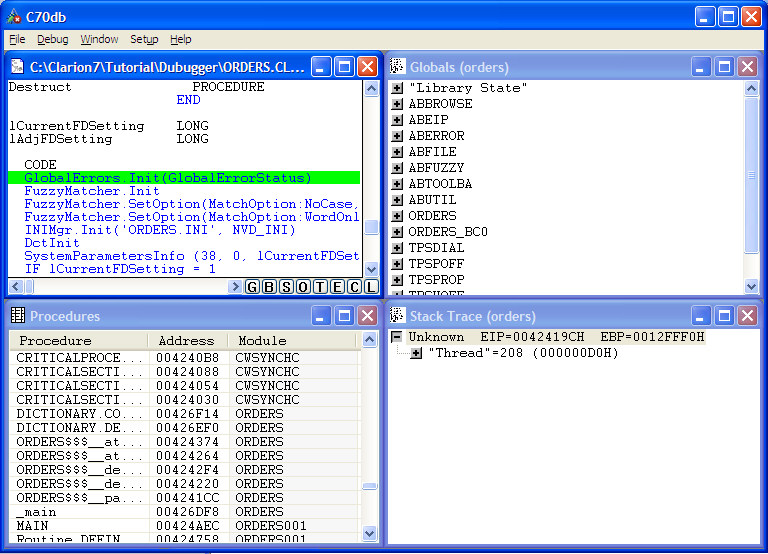
When you invoke the debugger, the Clarion IDE will re-make the project if needed, and then run the degugger. The debugger opens the Globals window, the Procedures window, the Stack Trace (local variables) window, and a starting source file.
The debugger also opens the Trace window and the Disassembly window in the iconized state.
Arrange the Debugger Windows
All of the debugger windows are movable and resizable. So you should arrange the windows so that they are easy for you to work with.
1.Maximize the debugger.
You will usually want to see several debugger windows at once, so you need as much screen space as possible.
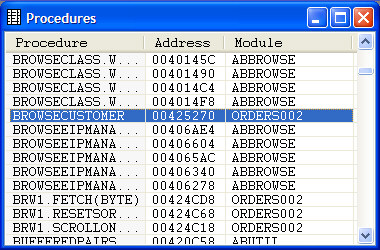
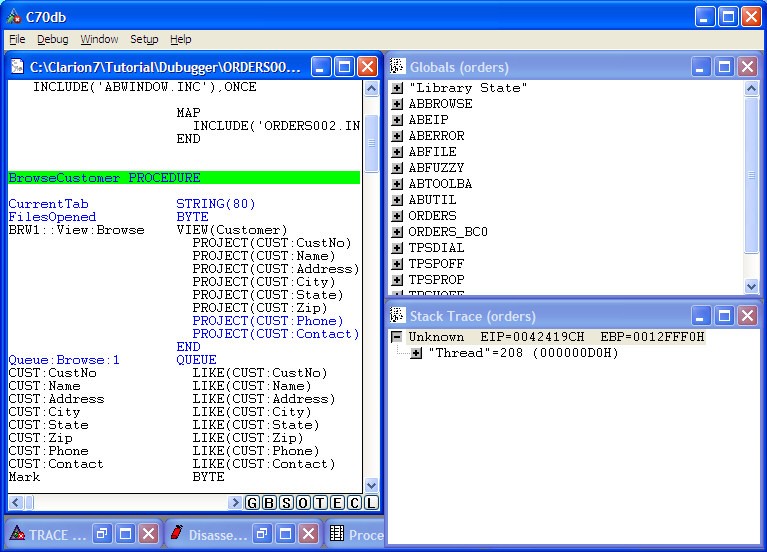
2.In the Procedures window, click BROWSECUSTOMER to open the source window for the BrowseCustomer procedure.
The debugger opens a source code window for ORDER002.CLW, the source module containing the BrowseCustomer procedure.
CLICK on the procedure or module headers to sort the respective columns in ascending order.
The Procedures window shows all the procedures and routines for the program you are debugging. CLICK on any procedure to see the source code for that procedure.
3.Reposition and resize the windows so they are easy for you to work with.
We recommend a layout that shows lots of source code, shows as many local variables as possible (in the Stack Trace window), and a watch window. You will need to adjust these windows according to your tastes.
Setting BreakPoints
A breakpoint tells the debugger that an application should break (pause execution) at a certain point.
Breakpoints allow you to suspend execution where and when you need to. Rather than stepping through your code line-by-line or instruction-by-instruction, you can allow your program to run until it hits a breakpoint, then start to debug. This speeds up the debugging process enormously.
You want to suspend (or break) the program at the point the bug occurs, and then look for the cause of the problem, usually in the form of incorrect variable values or incorrect execution sequence. Recall the bug is associated with scrolling downward. To set the breakpoint:
1.CLICK on the ORDER002.CLW window to give it focus.
2.Press the F key to open the Search for dialog.
A right-click on the source code window displays a popup menu of all the source window functions and their keyboard shortcuts.
3.In the Search for dialog, enter scrollone, and then press the OK button.
You will land on the ScrollOne method declared for the BRW1 class. Press the A key to find scrollone again. This time, you land on the label for the code of this method.
This method is a likely location for the breakpoint you need.
Searching is not case sensitive.
4.CLICK on the first executable statement after the code statement:
IF LOC:Flag
Although you can set a breakpoint on routine and method labels, you may get unexpected results. We recommend setting breakpoints only on executable statements.
5.Press the B button in the lower right section of the source window or press the B key to set a breakpoint on this statement.
You may also right-click and select Set Breakpoint from the popup menu. Or you may double-click the line. If you repeat any of these actions on the same line, it will clear the breakpoint.
The debugger displays breakpoints in red; however, because this is also the currently selected line (green), the breakpoint appears yellow until you move off the current line.
Debug the Program
The debugger is now set to suspend program execution at the first statement in the BRW1.ScrollOne method. To debug the program:
1.Press the G button or press the G key to start the Orders program.
The Orders program begins execution. Its main window opens on top of the debugger.
2.Choose Browse  Browse Customer Information file.
This opens the customer browse list.
3.With the customer list open, select a customer halfway down the list and click on the down arrow button  to scroll down one row.
The debugger detects the breakpoint, suspends the Orders program, and displays the breakpoint statement (with a yellow background).
4.Click on the Source window to give it focus, and click on the T button (or press the T key) to execute the next statement.
The debugger executes a single statement, then displays the next source statement to execute with a green background.
5.Repeat step 4 until after the PARENT.ScrollOne(Event) executes. This calls an ABC method, BrowseClass.ScrollOne in ABBROWSE.CLW:
BrowseClass.ScrollOne PROCEDURE(SIGNED Ev)
CODE
SELF.CurrentEvent = Ev
IF Ev = Event:ScrollUp AND SELF.CurrentChoice > 1
SELF.CurrentChoice -= 1
ELSIF Ev = Event:ScrollDown AND |
SELF.CurrentChoice <; SELF.ListQueue.Records()
SELF.CurrentChoice += 1
ELSIF ~SELF.FileLoaded
SELF.ItemsToFill = 1
SELF.Fetch(CHOOSE(Ev = EVENT:ScrollUp,1,2))
END
When you step through this method, only the first condition executes causing the current choice to move up one line.
Examine Variable Values
You can surmise that the above IF condition must be true in order for the customer list to scroll up one row, and the ELSIF condition must be true in order for the customer list to scroll down one row. You can examine (and modify) the values of the variables within the ELSIF condition to test this theory'EVENT:ScrollUp must be the event passed to this method. Also, SELF.CurrentChoice is greater than one, meaning the highlight row is not the first in the list box.
To examine and edit the variable values:
1.Press the G button or press the G key to continue executing the Orders program.
The Orders program gains focus and continues execution where it left off.
2.Again, click on the down arrow button to scroll down one row.
Again, the debugger detects the breakpoint, suspends the Orders program, and displays the breakpoint statement.
3.CLICK in the Stack Trace window, or choose Window  Stack Trace, or restore the minimized Stack Trace window.
4.In the Stack Trace window, RIGHT-CLICK on the EVENT variable.
This shows a popup menu. Select Watch Variable. A new window appears labeled Watch. Add the LOC:Flag variable in the same manner.
The watch window shows the label of the variable on the left and its value on the right. The value of EVENT is 4. The value of LOC:Flag is currently 3.
You can surmise that EVENT is getting the wrong value from LOC:Flag. In the next section, we'll test this theory by changing the value of LOC:Flag to a different number, for example, 4.
Edit Variable Values
1.In the Stack Trace window, RIGHT-CLICK on LOC:Flag, then choose Edit variable to open the Edit dialog.
2.In the Edit dialog, enter 4, then press OK.
The debugger changes the value of LOC:Flag to 4. Now you can continue execution of the Orders program to see if it scrolls properly.
3.With focus in the Source window, press the T button or press the T key to execute the next statement.
The debugger displays the next source statement to execute with a green background.
4.Repeat step 3 until the first statement in the BrowseClass.ScrollOne method executes.
Notice that the ELSIF conditional statements now executes. This is because the ELSIF condition is now true: Ev is equal to EVENT:ScrollDown, and the highlighted row is less than SELF.ListQueue.Records.
5.Press the G button or press the G key to continue executing the Orders program.
The Orders program continues execution where it left off.
This time, the customer list scrolls correctly! This confirms the theory that EVENT contains an incorrect value at this point in the program.
Examine Global Variable Values
Often you will want to examine global variables, record buffer values, and the values of Clarion's built-in “Library State functions (ACCEPTED(), EVENT(), ERRORCODE(), etc.).
To examine and edit these global variable values:
1.Again, press the down arrow key to scroll down one row.
Again, the debugger detects the breakpoint and suspends the Orders program.
2.CLICK in the Globals window, or choose Window  Globals.
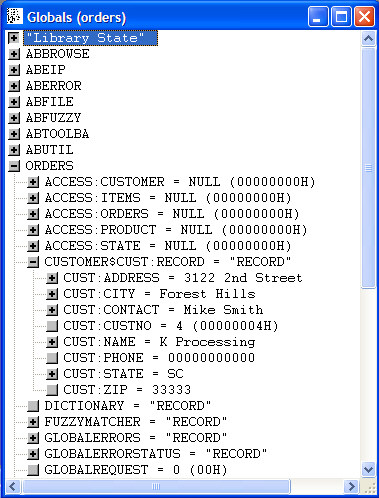
3.In the Globals window, click on the ( + ) beside ORDERS (near the bottom of the Globals list) to expand the list of global variables for the ORDERS module.
4.In the Globals window, click on the ( + ) beside CUSTOMER$CUST:RECORD to expand the list of customer record buffer fields.
5.In the Globals window, click on the ( + ) beside CUST:CONTACT to see the value of each byte in the CUST:CONTACT field.
The Globals window shows global variables, record buffers, and Library States. The labels are on the left and the values are on the right.
You may also edit global variables the same way you edited local variables.
Watch Selected Variables
The Watch window lets you pick specific variables (local, global, or both) and “Library States” to monitor during the debugging process. That is, rather than searching through the Stack Trace window and the Globals window with each debugging cycle, you can add the variables to the Watch window and examine all the pertinent values in one place.
To place variables in the Watch window:
1.In the Stack Trace window or the Globals Window, RIGHT-CLICK on an item (variable or Library State), then choose Watch variable.
This opens the Watch window and places the selected item in the window.
2.Repeat step 1 for all the pertinent variables and Library States.
Close the Debugger
1.In the debugger, choose File  Exit.
Exit.
The debugger automatically shuts down the debuggee (the Orders program) too.


